S&P 500 research guide
Original research published on . References to quote availability in the original study describe the service on its review date.
Independent guide to S&P 500: index methodology, verified constituent examples, market drivers, risk factors and official sources. Price-feed status explained.
- Market
- United States
- Constituents
- 500 companies (share classes may raise security count)
- Weighting method
- float-adjusted market-cap weighted
Index overview and methodology
S&P 500 follows five hundred prominent US companies selected under an eligibility methodology. It covers the large-cap segment rather than the entire stock market. Float-adjusted weighting means the biggest publicly investable companies can strongly influence headline returns; index membership is reviewed and is not a permanent endorsement.
Geography and market coverage
This benchmark follows securities associated with United States, but it cannot stand in for every listed business or the entire domestic economy. Interpreting its change requires distinguishing index level, percentage move, membership breadth and company fundamentals.
Why the weighting method matters
The weighting method is float-adjusted market-cap weighted. Constituents do not necessarily have equal influence. Share-price adjustments, free float and corporate actions may affect calculations, so comparing index movements requires more than simply counting advancing stocks.
What moves the benchmark?
Key factors to research include Corporate margins and earnings, Federal Reserve policy, US Treasury yields, sector concentration and global demand. No one variable guarantees the index direction. Investors should assess reported corporate data, expectations, broad economic conditions and international risk.
Earnings, discount rates and valuation
Expected earnings, profit margins, financing costs and government bond yields influence share valuations differently across sectors. An index may decline after apparently strong financial results if the market had expected still more growth.
Sector mix and concentration
Index-level advances can be concentrated in a few companies or sectors. Sector weights, top constituent contributions, rebalancing and market breadth are essential checks before extrapolating a benchmark move to the whole market.
Constituent companies and membership
The table below shows dated, source-supported component examples where available, without individual stock prices. It does not imply that a partial sample is the complete current constituent list. Full membership must be verified with the index administrator.
Index value, market hours and timestamps
No live index value is shown until a licensed feed covering the underlying benchmark has been confirmed. A future five-minute update process will record observation time, market status and delay, and will not confuse an ETF or CFD quote with the index itself.
Index versus ETF versus CFD
An index is a calculated benchmark rather than a directly owned security. ETFs are funds with distinct holdings, costs and traded prices. CFDs are derivatives with leverage and financing/liquidation risk and generally provide no ownership of constituent shares.
Investment and interpretation risks
Material risks include market volatility, interest rates, liquidity, currency movement, sector or country concentration and index reconstitution. Historical returns are not promises of future results. Suitability depends on the investor and product.
How to use this research page
Start with the index operator and calculation method, check the sample membership date, distinguish price return from total return variants, and verify the provenance and timestamp of any future index level. Follow official methodology rather than promotional price claims.
Index membership at the review date
Examples of index constituents recorded at the review date.
| Company | Ticker |
|---|---|
| NVIDIA | NVDA |
| Apple | AAPL |
| Microsoft | MSFT |
| Amazon | AMZN |
| Alphabet Class A | GOOGL |
| Broadcom | AVGO |
| Meta Platforms | META |
| Micron Technology | MU |
| Tesla | TSLA |
Questions about the index methodology
What is the S&P 500?
A benchmark covering 500 companies (share classes may raise security count) using a float-adjusted market-cap weighted methodology.
Can an investor buy an index itself?
No. An index is a calculated benchmark. ETFs and CFDs may offer different types of exposure with distinct ownership and risk characteristics.
Are the displayed quotes live?
No quote is displayed until a licensed primary index feed has been verified. ETF or CFD prices are not substituted.
Does the constituent list stay unchanged?
No. Membership and weights change after periodic index reviews and corporate actions; check the source and as-of date.
Do all constituents rise and fall together?
No. Weighted benchmarks can be driven by a handful of large or highly weighted constituents.
Is this an investment recommendation?
No. This page provides educational research and does not recommend specific trading actions.
S&P 500 research supplement
Supplement dated
Where does the weight come from?
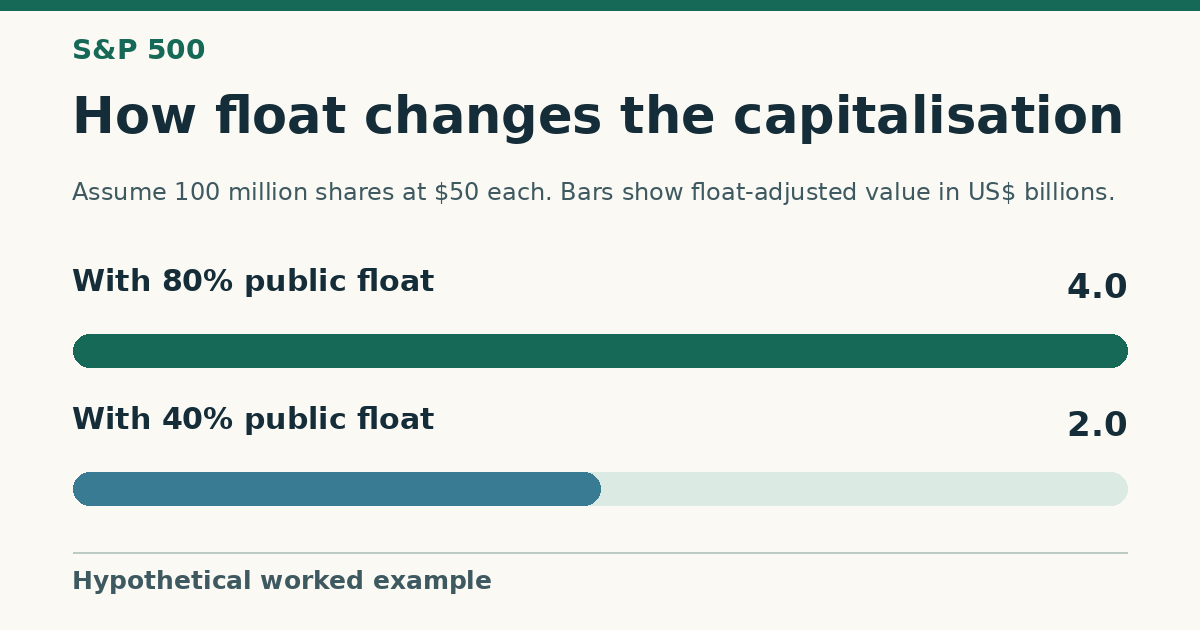
Suppose two businesses each have a million shares outstanding, each priced at fifty dollars. In a simplified example, all the shares of the first are available for public trading, while the index counts only half of the second company's shares as public float. The two businesses have the same headline market capitalization. They contribute fifty million dollars and twenty-five million dollars respectively to the float-adjusted calculation. Before any other differences, the first therefore has twice the index weight of the second. The example illustrates the weighting arithmetic after inclusion. It does not establish eligibility for the actual benchmark.
What does a sector return explain?
In another hypothetical session, a sector starts with a quarter of the benchmark's weight and gains two percent. Its contribution is about half a percentage point if membership and weights are taken at the beginning of that session. If the rest of the benchmark is flat, the overall return is about half a percent. A sector performance table usually gives the sector's own return. To explain the overall market move, a reader also needs the sector weight and the returns of the other sectors, all for the same benchmark and dates. A larger percentage move in a small sector can contribute less.
When are two returns comparable?
A cash dividend illustrates why the price and total return versions can produce different numbers. Imagine one share closes at one hundred dollars, then closes at ninety-nine dollars on the day it begins trading without entitlement to a one-dollar dividend. With no other influences, the stock price has fallen one percent. An owner who started with that share holds a share worth ninety-nine dollars and is entitled to the one-dollar payment before taxes. A total return calculation incorporates distributions under its reinvestment convention. A multiyear comparison of a fund and the index can therefore change materially when one series includes distributions and the other uses prices alone.
Why can a replacement leave the level steady?
Changing a constituent changes the mix of companies represented. The index uses a divisor so that replacing one position with another does not by itself register as a gain or loss. In an imaginary calculation, a basket has an adjusted value of ten million dollars and a divisor of ten thousand, giving a level of one thousand points. If a membership change takes the basket value to eleven million with prices otherwise fixed, a divisor of eleven thousand preserves the same level. Subsequent price moves now reflect the new membership. This explains how a continuous chart can span materially different groups of companies.
Reading an archived sample of names
An archived table with a few S&P 500 constituents can document which examples the editor reviewed at the time. Its rows alone cannot recover the index return or the former weight of any particular company. For a historical comparison, the matching records would include the effective membership, the shares used for weighting and the exchange rates where relevant to the return series being compared. In a chart based on the same dollar benchmark, indexing two periods to a starting value of one hundred makes their percentage paths comparable. It still leaves the identity and weights of individual contributors unresolved.