Nasdaq Composite research guide
Original research published on . References to quote availability in the original study describe the service on its review date.
Independent guide to Nasdaq Composite: index methodology, verified constituent examples, market drivers, risk factors and official sources. Price-feed status explained.
- Market
- United States
- Constituents
- thousands of listed securities
- Weighting method
- market-cap weighted
Index overview and methodology
Nasdaq Composite covers eligible common-stock-type securities listed on Nasdaq, including US and international issuers. It should never be confused with Nasdaq-100, which is a separate, narrower benchmark. Concentration in large growth-oriented companies may drive performance even when many smaller companies move differently.
Geography and market coverage
This benchmark follows securities associated with United States, but it cannot stand in for every listed business or the entire domestic economy. Interpreting its change requires distinguishing index level, percentage move, membership breadth and company fundamentals.
Why the weighting method matters
The weighting method is market-cap weighted. Constituents do not necessarily have equal influence. Share-price adjustments, free float and corporate actions may affect calculations, so comparing index movements requires more than simply counting advancing stocks.
What moves the benchmark?
Key factors to research include Interest-rate expectations, semiconductor demand, enterprise software spending, large-cap earnings, capital expenditure and market breadth. No one variable guarantees the index direction. Investors should assess reported corporate data, expectations, broad economic conditions and international risk.
Earnings, discount rates and valuation
Expected earnings, profit margins, financing costs and government bond yields influence share valuations differently across sectors. An index may decline after apparently strong financial results if the market had expected still more growth.
Sector mix and concentration
Index-level advances can be concentrated in a few companies or sectors. Sector weights, top constituent contributions, rebalancing and market breadth are essential checks before extrapolating a benchmark move to the whole market.
Constituent companies and membership
The table below shows dated, source-supported component examples where available, without individual stock prices. It does not imply that a partial sample is the complete current constituent list. Full membership must be verified with the index administrator.
Index value, market hours and timestamps
No live index value is shown until a licensed feed covering the underlying benchmark has been confirmed. A future five-minute update process will record observation time, market status and delay, and will not confuse an ETF or CFD quote with the index itself.
Index versus ETF versus CFD
An index is a calculated benchmark rather than a directly owned security. ETFs are funds with distinct holdings, costs and traded prices. CFDs are derivatives with leverage and financing/liquidation risk and generally provide no ownership of constituent shares.
Investment and interpretation risks
Material risks include market volatility, interest rates, liquidity, currency movement, sector or country concentration and index reconstitution. Historical returns are not promises of future results. Suitability depends on the investor and product.
How to use this research page
Start with the index operator and calculation method, check the sample membership date, distinguish price return from total return variants, and verify the provenance and timestamp of any future index level. Follow official methodology rather than promotional price claims.
Index membership at the review date
This edition did not include a dated constituent table.
Questions about the index methodology
What is the Nasdaq Composite?
A benchmark covering thousands of listed securities using a market-cap weighted methodology.
Can an investor buy an index itself?
No. An index is a calculated benchmark. ETFs and CFDs may offer different types of exposure with distinct ownership and risk characteristics.
Are the displayed quotes live?
No quote is displayed until a licensed primary index feed has been verified. ETF or CFD prices are not substituted.
Does the constituent list stay unchanged?
No. Membership and weights change after periodic index reviews and corporate actions; check the source and as-of date.
Do all constituents rise and fall together?
No. Weighted benchmarks can be driven by a handful of large or highly weighted constituents.
Is this an investment recommendation?
No. This page provides educational research and does not recommend specific trading actions.
Nasdaq Composite research supplement
Supplement dated
Which Nasdaq appears in the headline?
A headline that says “Nasdaq rose” can refer to different benchmarks. Nasdaq calls its Composite COMP, while NDX identifies the Nasdaq-100. The Composite draws eligible securities from listings across the exchange. The Nasdaq-100 selects large nonfinancial companies. A bank can therefore belong to the first universe even though its industry makes it ineligible for the second. A useful check when two charts appear to disagree is to read the full benchmark name on both. On a fund page the relevant field is the name of the index it tracks. The fund's own trading symbol identifies a different instrument.
What counts as a constituent?
A stock exchange offers several kinds of securities, and the Composite's rules select among them. Common stocks and eligible depositary receipts can enter. Exchange traded funds and preferred stocks are generally excluded. An issuer can have more than one eligible share class. Consequently, a table with one row per security can have more rows than a table with one row per company, even on the same date. To reconcile two lists, match the security identifier and share class before counting. Matching only the company name could accidentally remove an eligible second line as a duplicate.
How much did one stock contribute?
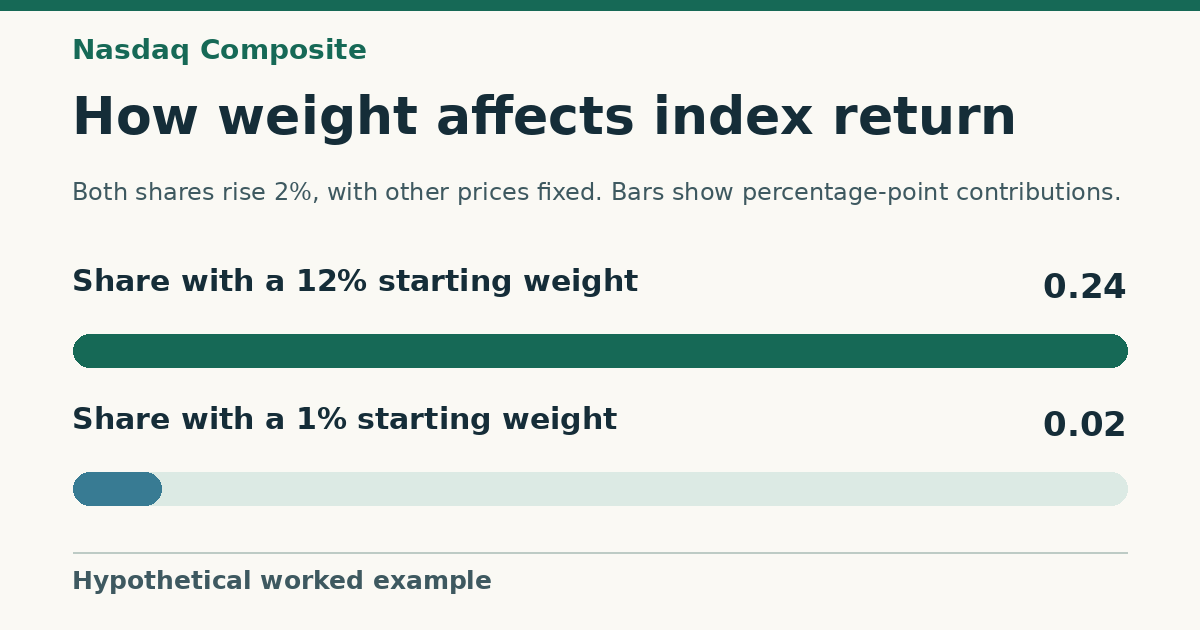
Imagine a company that represents eight percent of a hypothetical basket at the previous close. A ten percent gain in that stock contributes about 0.8 percentage points to the basket's return, with membership and share counts held constant. If the remaining stocks together represented ninety-two percent and lost one percent as a group, their contribution would be minus 0.92 percentage points. The combined result would be a decline of about 0.12 percent. This example uses invented weights. Reconstructing an actual move requires the weights at the beginning of the period and returns measured over matching hours.
Did the gain reach most companies?
Two newsrooms can accurately describe the same session very differently. One reports the Composite's return, which reflects the relative market values of its eligible securities. Another counts how many securities rose and how many fell, giving each observation one vote. Imagine that four large securities gained while six smaller securities ended lower. The count would show more decliners, even if the combined gains in market value outweighed the losses. Where a report quotes exchange-wide breadth, check its universe. It may include a wider set of listings than the securities counted in the benchmark itself.
Comparing a past session with the archive
Rebuilding a historical closing move begins with the membership that applied on that day. A list downloaded later can contain entrants that had not yet qualified and omit securities that subsequently left. An article may also have been published after several sessions while its headline refers to just one. Record the last session covered, the previous close used as the comparison point, and the time attached to each observation. If a price feed is temporarily unavailable, a news headline or an old constituent table still has a date and context of its own. Neither supplies the missing closing observation.