Dow Jones Industrial Average research guide
Original research published on . References to quote availability in the original study describe the service on its review date.
Independent guide to Dow Jones Industrial Average: index methodology, verified constituent examples, market drivers, risk factors and official sources. Price-feed status explained.
- Market
- United States
- Constituents
- 30 companies
- Weighting method
- price weighted
Index overview and methodology
The Dow tracks thirty established US companies selected across several major sectors. Its price-weighted construction differs from the market-cap approach used by the S&P 500; a higher-priced share can contribute more to the index move even if the underlying company is smaller. The index does not represent all American listed companies.
Geography and market coverage
This benchmark follows securities associated with United States, but it cannot stand in for every listed business or the entire domestic economy. Interpreting its change requires distinguishing index level, percentage move, membership breadth and company fundamentals.
Why the weighting method matters
The weighting method is price weighted. Constituents do not necessarily have equal influence. Share-price adjustments, free float and corporate actions may affect calculations, so comparing index movements requires more than simply counting advancing stocks.
What moves the benchmark?
Key factors to research include Earnings from industrial, financial, healthcare and consumer companies; US interest rates; global trade and the dollar; company-specific corporate actions. No one variable guarantees the index direction. Investors should assess reported corporate data, expectations, broad economic conditions and international risk.
Earnings, discount rates and valuation
Expected earnings, profit margins, financing costs and government bond yields influence share valuations differently across sectors. An index may decline after apparently strong financial results if the market had expected still more growth.
Sector mix and concentration
Index-level advances can be concentrated in a few companies or sectors. Sector weights, top constituent contributions, rebalancing and market breadth are essential checks before extrapolating a benchmark move to the whole market.
Constituent companies and membership
The table below shows dated, source-supported component examples where available, without individual stock prices. It does not imply that a partial sample is the complete current constituent list. Full membership must be verified with the index administrator.
Index value, market hours and timestamps
No live index value is shown until a licensed feed covering the underlying benchmark has been confirmed. A future five-minute update process will record observation time, market status and delay, and will not confuse an ETF or CFD quote with the index itself.
Index versus ETF versus CFD
An index is a calculated benchmark rather than a directly owned security. ETFs are funds with distinct holdings, costs and traded prices. CFDs are derivatives with leverage and financing/liquidation risk and generally provide no ownership of constituent shares.
Investment and interpretation risks
Material risks include market volatility, interest rates, liquidity, currency movement, sector or country concentration and index reconstitution. Historical returns are not promises of future results. Suitability depends on the investor and product.
How to use this research page
Start with the index operator and calculation method, check the sample membership date, distinguish price return from total return variants, and verify the provenance and timestamp of any future index level. Follow official methodology rather than promotional price claims.
Index membership at the review date
This dated list was checked against holdings of the DIA index-tracking fund.
| Company | Ticker |
|---|---|
| NVIDIA | NVDA |
| Apple | AAPL |
| Microsoft | MSFT |
| Amazon | AMZN |
| Walmart | WMT |
| JPMorgan Chase | JPM |
| Visa | V |
| Johnson & Johnson | JNJ |
| Chevron | CVX |
| Cisco Systems | CSCO |
| Coca-Cola | KO |
| UnitedHealth Group | UNH |
| Merck | MRK |
| Procter & Gamble | PG |
| Caterpillar | CAT |
| Home Depot | HD |
| Goldman Sachs | GS |
| Amgen | AMGN |
| IBM | IBM |
| American Express | AXP |
| Salesforce | CRM |
| Walt Disney | DIS |
| Alphabet Inc. Class A | GOOGL |
| McDonald's | MCD |
| Boeing | BA |
| 3M | MMM |
| Travelers | TRV |
| Sherwin-Williams | SHW |
| Honeywell Technologies | HON |
| Nike | NKE |
Questions about the index methodology
What is the Dow Jones Industrial Average?
A benchmark covering 30 companies using a price weighted methodology.
Can an investor buy an index itself?
No. An index is a calculated benchmark. ETFs and CFDs may offer different types of exposure with distinct ownership and risk characteristics.
Are the displayed quotes live?
No quote is displayed until a licensed primary index feed has been verified. ETF or CFD prices are not substituted.
Does the constituent list stay unchanged?
No. Membership and weights change after periodic index reviews and corporate actions; check the source and as-of date.
Do all constituents rise and fall together?
No. Weighted benchmarks can be driven by a handful of large or highly weighted constituents.
Is this an investment recommendation?
No. This page provides educational research and does not recommend specific trading actions.
Dow Jones Industrial Average research supplement
Supplement dated
Why a dollar move matters
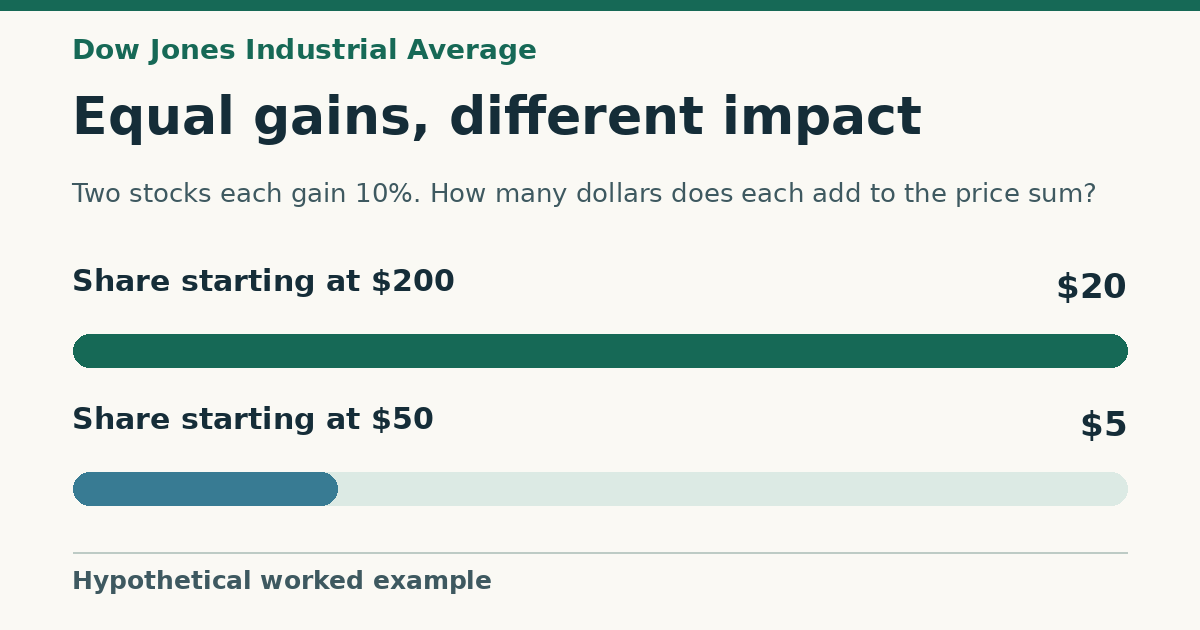
Consider two hypothetical Dow constituents priced at one hundred and two hundred dollars. A move of one dollar in either adds the same amount to the sum of component prices before division. As a percentage of the stock price, however, the changes are one percent and half a percent respectively. If instead both stocks climb one percent, the second stock adds two dollars to the numerator while the first adds one. This distinction explains a common gap between a table ranking stocks by percentage return and a table ranking the same stocks by their contribution to the Dow's point change.
A split that changes the next day's influence
Imagine a basket containing two stocks priced at one hundred and two hundred dollars, with a divisor of three. Its level is one hundred points. The second stock splits two for one and now costs one hundred dollars per share. A divisor of two preserves the index level at one hundred points with other prices unchanged. Both stocks now have the same dollar price and the same weight in this small example. Before the split, the higher-priced stock had twice the weight. The mechanical adjustment preserves continuity on the date of the split while leaving a different balance of influences on later sessions.
What a point headline measures
A move of three hundred points provides a distance in index units. The previous closing level supplies the denominator needed to judge its size. In a hypothetical session starting at thirty thousand, three hundred points represents one percent. Starting at forty thousand, the same distance represents three quarters of one percent. A report describing the largest point decline among several sessions may therefore rank them differently from a report comparing percentage losses. Both comparisons can be calculated from the same series. Confirm whether the quoted distance is measured from the last close or from the highest reading earlier that day.
Which companies does “industrial” describe?
The name survives from the index's history. The modern benchmark includes companies working in varied industries and has separate companion averages covering transportation and utilities. This changes the interpretation of an apparent disagreement between an industry headline and the Dow. For example, a story about rail freight can describe conditions for transport operators that have their own benchmark. Whether a particular Dow member is affected indirectly depends on its own business. For a historical report, the dated roster identifies which companies contributed directly to that day's calculation, even when the news also describes economic effects on companies outside the roster.
Tracing an individual contribution
To reconstruct a close, start with the actual prices and the divisor effective for the observation. In a simple session with an unchanged divisor of one quarter, a two-dollar gain in one stock contributes eight index points. A one-dollar fall in a second subtracts four points. The remaining stocks' dollar movements determine the rest of the result. Numbers rounded for display can produce a small discrepancy, particularly when summed across the full membership. For a session containing a corporate action, use the administrator's adjusted reference and effective divisor. Comparing unadjusted closing prices across a split could otherwise produce a sizeable fictional loss.